
The US economy shows mixed signals this week cooling inflation, falling GDP projections, and rising oil prices. Here’s what it means for markets and households.
U.S. Economy Flashes Contradictory Signals: Cooling Inflation Masks a Deeper Growth Contraction
Last Updated: April 2026
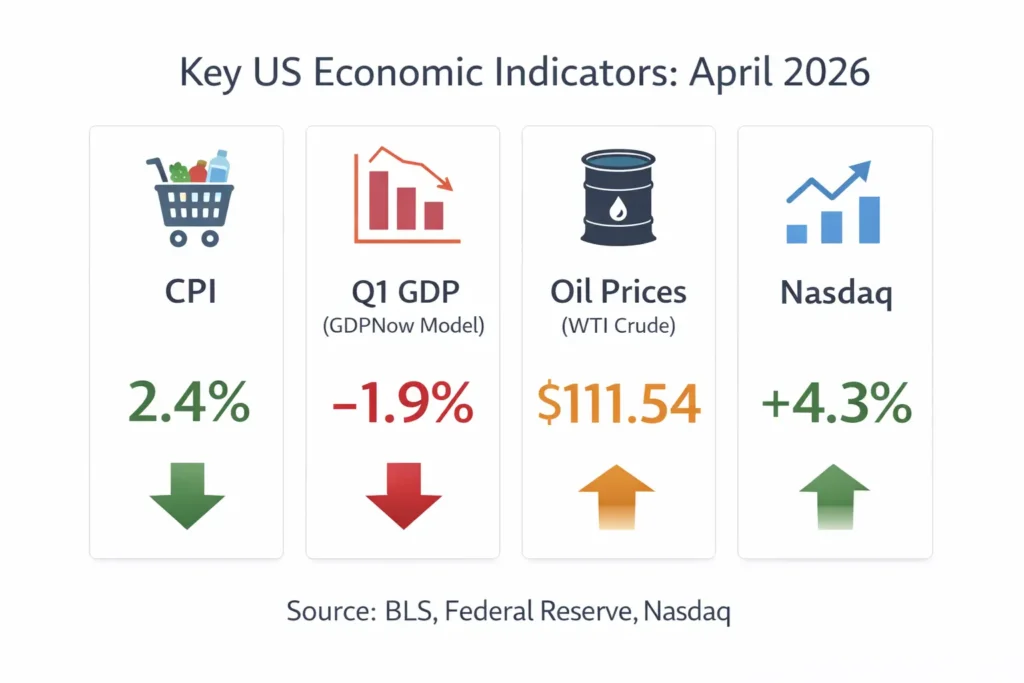
Data Sources: Bureau of Labor Statistics (BLS), Federal Reserve (GDPNow), Market Data
What Happened This Week
March inflation data suggested stability, with headline CPI holding near 2.4%. Markets initially responded positively.
However, real-time economic indicators tell a different story. The Atlanta Fed’s GDPNow model is currently tracking Q1 growth at -1.9%, signaling a potential contraction.
At the same time, a sharp rise in oil prices driven by geopolitical tensions is beginning to feed into the global cost structure creating pressure that monetary policy cannot easily offset.
US Economy Update
Inflation vs. Growth: A Growing Disconnect
- CPI (lagging): ~2.4%
- GDPNow (real-time): -1.9%
This divergence highlights a key issue:
inflation data reflects the past, while growth data reflects the present.
Labour market signals remain mixed.
- March jobs showed a +60K increase
- February saw a -92K decline, partly due to strike activity
The rebound appears modest when viewed in context, suggesting the labor market may be losing momentum rather than strengthening.
Federal Reserve Position
- Current rate: 3.50%–3.75%
- Outlook: One rate cut projected in 2026
With growth weakening and external inflation pressures rising, this stance increasingly appears misaligned with current conditions.
Trade Deficit Widens
- February deficit: $57.3 billion
Rising import costs particularly energy and industrial inputs are beginning to shift the trade balance and add pressure to domestic pricing.
Global Events Impacting the US
The “Hormuz Effect” and Oil Shock
- WTI crude: +11.41% → $111.54
Supply risks in key shipping routes have pushed oil prices higher. This type of shock sits outside the Federal Reserve’s control, making it more difficult to manage inflation through interest rates alone.
Rising Trade Friction with China
- Renewed tension around Section 301 tariffs
- Signals from China suggest the era of ultra-cheap imports may be ending
This introduces structural cost pressure on US retail and manufacturing supply chains.
A New Oil Price Floor?
Increased shipping insurance costs and rerouting logistics are creating a sustained pricing floor above $100.
This suggests elevated energy costs may persist longer than markets initially expected.
Markets This Week
Equities
- Nasdaq: +4.3%
The rally is being interpreted by some analysts as overly optimistic, driven by easing geopolitical sentiment rather than improving fundamentals.
Bond Market
- 10-year Treasury yield: ~4.33%
Rather than signaling easing inflation, this move reflects a risk-off shift toward safety.
Sector Trends
- Outperforming: Energy, Defense
- Under pressure: Consumer Discretionary
Retail-facing companies are beginning to show early signs of margin compression.
What It Means
For the Middle Class
A dual pressure is forming:
- Energy shock → Higher fuel costs → Higher food and transport prices
- Tariffs → Increased retail prices
This creates a “double squeeze” where costs rise from multiple directions before wages or policy adjustments can respond.
For Investors
Traditional portfolios may face challenges:
- The classic 60/40 allocation becomes vulnerable in a stagflation-like environment
- Energy and defense sectors are currently benefiting from macro conditions
The Bigger Picture
These are not isolated developments.
They form a single chain reaction:
Geopolitical tension → Oil price surge → Rising consumer costs → Corporate margin pressure → Potential equity correction
What to Watch Next Week
| Indicator | Why It Matters |
|---|---|
| May CPI / Core PCE | Watch for core inflation above 3.0% |
| Q1 GDP Estimate | Confirms or challenges -1.9% projection |
| Fed Speeches | Signals on rate cuts or policy shift |
| WTI Crude Prices | Sustained $110+ impacts retail pricing |
| Retail Earnings (Walmart, Target) | Early insight into tariff impact |
Featured Insight
Is the US economy heading toward a recession in 2026?
Real-time data suggests a growing risk. While inflation appears stable at around 2.4%, forward-looking indicators like GDPNow show contraction. This gap between lagging and real-time data suggests the current “soft landing” narrative may not fully reflect underlying economic conditions.
Frequently Asked Questions
Why does inflation look stable if the economy is weakening?
Inflation is a lagging indicator. It reflects price changes that have already occurred. In contrast, real-time models like GDPNow track current economic output, which can decline before inflation reacts.
How do oil price spikes affect everyday costs?
Energy costs are embedded across supply chains transport, food production, and logistics. A sustained increase in oil prices typically impacts consumer prices within 4–6 weeks.
Should investors be cautious about the recent market rally?
Some analysts believe recent gains may not reflect underlying risks. With earnings pressure building in consumer sectors, market optimism could face adjustment if macro conditions worsen.
Final Takeaway
This week’s data highlights a critical shift:
- Inflation appears stable
- Growth is weakening
- External pressures are rising
The key risk is not any single factor but how they interact.
Understanding this broader picture is essential for both households and investors navigating the months ahead.
Disclaimer: This content is for informational purposes only and does not constitute financial or investment advice. Market conditions change rapidly, and readers should consult a qualified financial professional before making any decisions. The author is not liable for any actions taken based on this information.